Several indicators are signaling an increase in the probability of a recession. Most of these indicators are variables that have shown to be statistically leading the recession but they cannot always be seen as the cause of one (for example, an inverted yield curve)
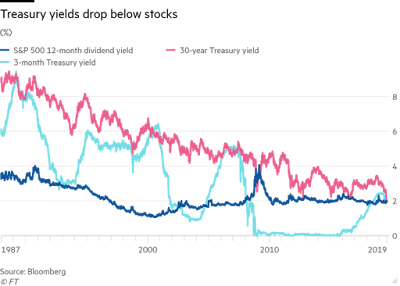
In the search of a cause for a recession we typically look for imbalances. One that has mattered in the past is asset price bubbles. Standard valuation metrics of the stock market suggest that in the last quarters the market has gotten cheaper and moved further away from bubble territory. The Financial Times reports that US companies dividend yield is now larger than the interest rates on a 30 year government bond (see image below). This is not at all a new phenomenon in Europe where the dividend yield has been larger than the interest rate on bonds for years and is now reaching record levels.
 The risk premium has climbed back up to levels (around 4%) that are average for the post-2008 period and significantly higher than in previous decades (high risk premium means that stocks look cheaper relative to bonds - assuming risk attitudes or perceptions are not changing).
What is more significant is that the risk premium is much larger than in the quarters prior to the previous two recessions. In the quarters prior to the 2001Q1 recession the risk premium was negative. In the quarters prior to the 2007Q4 recession the risk premium was falling and below 2% for several quarters. We are now at 4%, far away from any of those magnitudes.
Similar calculations for Europe produce an even "cheaper" stock market (relative to bonds). P/E ratios are as low as 19 for Germany. Combined with a -0.7% yield on a 10 year government bond and assuming inflation around 1.5% means a risk premium of 7.5%. Almost as high as during the panic years of the last crisis (2009) in the US.
Antonio Fatas
____
Methodology: under certain assumptions the expected ex-ante real return of the stock market can be approximated by the inverse of the P/E ratio. The risk premium can then be calculated as the difference between this magnitude and the real yield on a 10-year government bond. See Blanchard and Gagnon for alternative calculations of the risk premium.
Sources of data: P/E ratios and nominal 10-year interest rates from Robert Shiller; forecasts of inflation from the survey of professional forecasters posted at the Philadelphia Fed.
In the search of a cause for a recession we typically look for imbalances. One that has mattered in the past is asset price bubbles. Standard valuation metrics of the stock market suggest that in the last quarters the market has gotten cheaper and moved further away from bubble territory. The Financial Times reports that US companies dividend yield is now larger than the interest rates on a 30 year government bond (see image below). This is not at all a new phenomenon in Europe where the dividend yield has been larger than the interest rate on bonds for years and is now reaching record levels.

A good way to summarize the improvement in the valuation of stocks is to calculate the ex-ante risk premium. The image below shows the risk premium for the US stock market (S&P 500) from 1991 until today (see sources and methodology at the end of this post).

What is more significant is that the risk premium is much larger than in the quarters prior to the previous two recessions. In the quarters prior to the 2001Q1 recession the risk premium was negative. In the quarters prior to the 2007Q4 recession the risk premium was falling and below 2% for several quarters. We are now at 4%, far away from any of those magnitudes.
Similar calculations for Europe produce an even "cheaper" stock market (relative to bonds). P/E ratios are as low as 19 for Germany. Combined with a -0.7% yield on a 10 year government bond and assuming inflation around 1.5% means a risk premium of 7.5%. Almost as high as during the panic years of the last crisis (2009) in the US.
Antonio Fatas
____
Methodology: under certain assumptions the expected ex-ante real return of the stock market can be approximated by the inverse of the P/E ratio. The risk premium can then be calculated as the difference between this magnitude and the real yield on a 10-year government bond. See Blanchard and Gagnon for alternative calculations of the risk premium.
Sources of data: P/E ratios and nominal 10-year interest rates from Robert Shiller; forecasts of inflation from the survey of professional forecasters posted at the Philadelphia Fed.
Comments
Post a Comment